

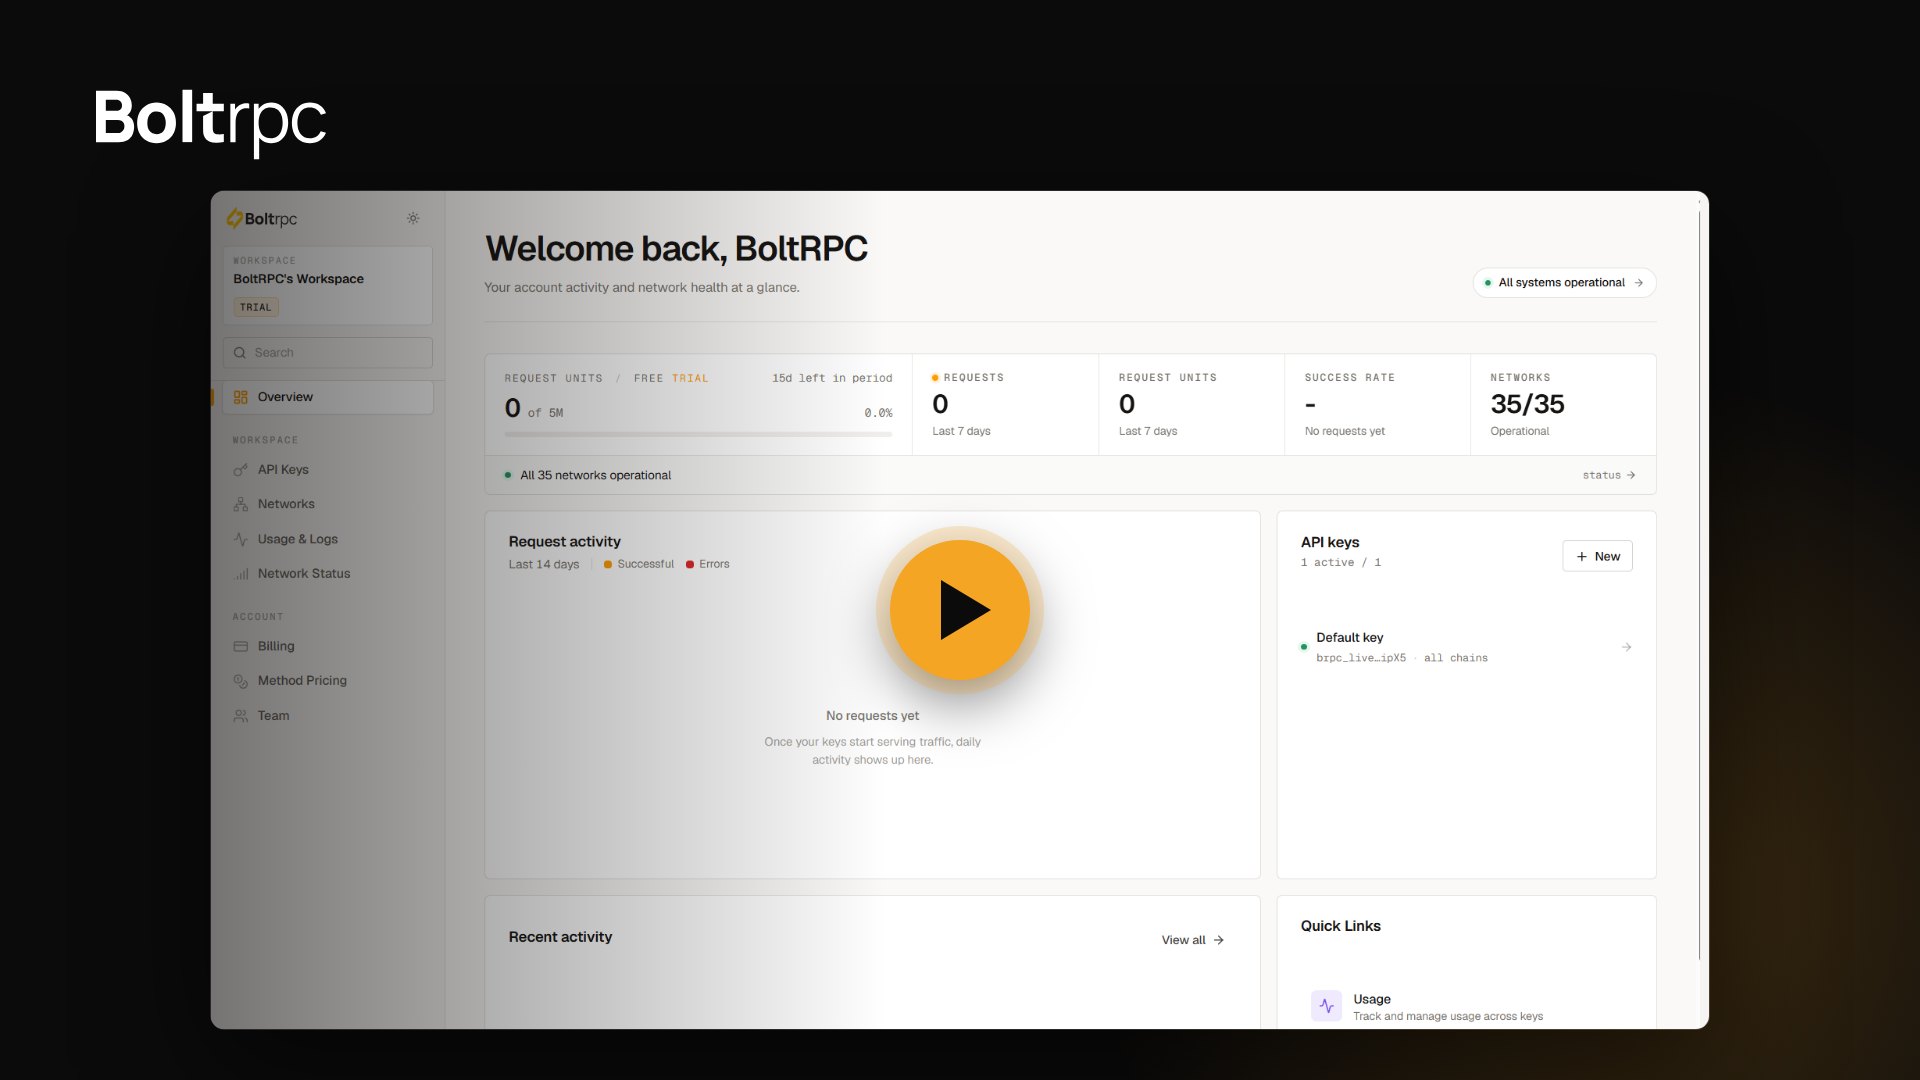
The BoltRPC dashboard is the self-serve control panel for your RPC infrastructure. Create API keys, pick your networks, track your request unit usage, manage billing, check network status: all in one place. Sign in at dashboard.boltrpc.io with your password, a magic link, or your Google or GitHub account. Every new account can start a free trial without a credit card; the current trial terms are on the pricing page.
Getting started on BoltRPC used to mean a short conversation with our team. That conversation is still there whenever you want it. You can also go from signup to your first successful request in a few minutes, on your own. This guide walks through every screen so you always know where to click.
Everything in the video above is written out below as well, so you never have to watch it to find an answer.
What can you do from the dashboard?
Everything that used to require an email now lives in the sidebar:
- API Keys. Create, scope, rotate or delete keys. Each key can span one chain or many.
- Networks. Browse every chain you can reach, with per-network detail.
- Usage & Logs. Real-time request unit spend, per-method breakdowns and request logs for debugging.
- Network Status. The operational state of the infrastructure, live.
- Method Pricing. The published request unit weight of every method, inside the dashboard.
- Billing. Your plan, invoices, payment method and the on-demand usage control.
- Team. Invite colleagues into your workspace so the whole squad works from the same account.
Profile, security and preferences live under Settings, reachable from the quick links on the Overview page.
The rest of this guide walks through the flow you will actually follow on day one: account, key, endpoint, first request.
How do I create an account and start the free trial?
Go to dashboard.boltrpc.io, enter your email address and choose a password. Google and GitHub sign-in are available too, and once your account exists you can also sign in with a magic link sent to your inbox.
New accounts land on the Overview page with a short onboarding checklist. It takes three steps:
- Verify your email address. Enter the 8-digit code from your inbox.
- Link your GitHub account, pick your chains, start your free trial. Linking GitHub verifies the account: one trial per GitHub identity, no credit card required. Then choose the chains for your first key, or select all of them, and press Start free trial. The current allowance and length are on the pricing page.
- Reveal your API key. The trial key is created for you the moment the trial starts. Reveal it, copy it, start building. Trial accounts include this one key.
The trial is a real production trial, not a sandbox. Your requests go through the same production infrastructure, with automatic failover, that serves every paying customer.
How do I create an API key?
During the free trial your key is created for you the moment the trial starts. Open API Keys in the sidebar: the key is listed there with Reveal and Copy next to it. Click the pencil on the right of the row to open the key’s settings in a side panel. Three things sit at the top:
- A name. Pick something that tells you what the key is for: “production”, “staging”, “indexer”.
- A status switch. Turn a key off without deleting it, then back on when you need it again.
- Your chains. Select the networks this key should reach. You can scope a key to a single chain or span it across the networks on your plan. See every network on the Networks page.
On a paid plan you create as many keys as your project needs with New API key on the same page. Every key, trial or paid, carries the same settings. Reveal and Copy stay available on the API Keys page, and you can rotate or delete keys there at any time, so a leaked key never has to be a drama.
Can I lock a key down?
Yes. It is worth doing before the key ever reaches production. Underneath the name and chain selection, the same panel gives you a full set of controls. Only expiry needs a choice; the rest is optional. Changes reach the edge within about 30 seconds of you saving them.
- Expiry. Give the key an end date, or tick the never option. A dated key is the safer default for anything temporary: a contractor, a demo, a one-off backfill you will forget about.
- Allowed IP addresses. One address or CIDR block per line. Leave it empty and the key works from anywhere. Fill it in and the key answers from your own servers alone, which makes a copied key worthless off your network.
- Allowed origins. For keys that run in a browser. One origin per line, wildcards included, so
https://*.example.comcovers every subdomain you have. Once you set this, requests that arrive without an Origin or Referer header are refused, which is exactly why you leave it empty for server side keys. The same allowlist governs gRPC-Web calls. - Method policy. Restrict which JSON-RPC methods this key is allowed to call, so a key sitting in a public frontend cannot be picked up and used to send transactions. Allow a fixed list of methods, or block specific ones.
- Rate limit and daily request cap. Optional ceilings on this specific key, in requests per second and requests per day. The daily cap resets at 00:00 UTC.
Leave all of it empty and you get an ordinary key that works everywhere. Fill it in and you get a key you can hand to a contractor, drop into a browser bundle or ship in a client build without it keeping you up at night. None of this is a paid add-on or an enterprise tier: it sits in the same panel as the key’s name, on every plan. Press Save changes when you are done.
Where do I connect? Your endpoint URLs
With your key in hand, your endpoints follow one simple pattern for every network:
HTTPS:  https://endpoints.boltrpc.io/rpc/YOUR_API_KEY/{network}
WSS:    wss://endpoints.boltrpc.io/ws/YOUR_API_KEY/{network}
Replace {network} with the slug of your chain (ethereum, polygon, base, arbitrum and the rest of the Networks page) and YOUR_API_KEY with your API key. Every BoltRPC key starts with brpc_live_: paste the whole key, prefix included.
Test the connection with a single copy-paste command:
curl -X POST "https://endpoints.boltrpc.io/rpc/YOUR_API_KEY/ethereum" \
  -H "Content-Type: application/json" \
  -d '{"jsonrpc":"2.0","method":"eth_blockNumber","params":[],"id":1}'
A healthy response looks like this:
{"jsonrpc":"2.0","id":1,"result":"0x18c9614"}That hex string is the latest block number. If you see it, your key works, your endpoint works, you are live. Point your ethers.js provider, viem client or web3.py instance at the same URL and everything behaves like any standard JSON-RPC endpoint.
You do not have to build these URLs by hand. On the API Keys page, open the connection details of your key and pick a chain: the dialog gives you the HTTPS and WebSocket URL with your key already in it, ready to copy, and a starter snippet for ethers, viem, web3.py and more.
How do I track my usage?
The Usage & Logs page shows your request unit spend in real time: total consumption for the last seven days by default, a breakdown per method, then the request log underneath. Every row in that log is a real request with its method, network, status and cost. Filter by key, network or method to see exactly where your request units are going, then export the result as CSV or NDJSON. The same page carries a Response time panel with your own P50, P95 and P99, which you can split by network, by method or both, with the sample count shown next to it. That is how long our nodes took to answer your requests, measured at our proxy from the moment a request goes upstream until the node answers. Gateway and authentication time are not in it, and neither is the path between your server and ours, so your own client will always see a little more.
BoltRPC meters usage in request units (RU) with fixed, published weights per method. Most standard calls cost 3 RU, eth_getLogs costs 4, eth_sendRawTransaction costs 5. You know the cost of every call before you build, which makes a monthly bill something you can calculate in advance instead of discover afterwards. The full weight table lives in our guide to how request units are weighted.
The same table is in the dashboard under Method Pricing, so you can check the cost of a call without leaving the page you are working in. The page opens with a cost calculator: pick a method, set the number of calls you expect per month, then read the estimated cost against the plan of your choice.
On a paid plan your budget is monthly rather than per second, so capacity planning is arithmetic instead of guesswork. The free trial carries a per-second ceiling, listed on the pricing page. If you want to go deeper on why that model is kinder to real workloads, we wrote a full piece on designing around RPC rate limits.
What do the BoltRPC plans look like?
When your trial ends, pick the plan that fits your volume on the Billing page. There are four self-serve tiers, Builder, Pro, Business and Enterprise, and a Custom plan on request for volumes above that. Billing runs monthly or annually, with a discount on annual. Current allowances, prices and support levels are on the pricing page. Need more volume than the listed tiers? Contact us with the numbers you expect and what you are building, then we put something together.
The accepted payment methods are listed on the pricing page.
One feature we are particularly happy with: on-demand usage. It is optional, off by default. If you enable it, you set your own monthly spending limit, so usage beyond your plan is always a choice you made in advance with a cap you control. No surprises on the bill, ever.
How do I check network status?
The Network Status page in the sidebar shows the operational state of every network you can reach, straight from the dashboard. If you ever wonder whether an issue is on your side or ours, that page is your first stop.
How does my team share an account?
Open Team in the sidebar to invite colleagues into your workspace. Everyone you add works from the same account, so by default there is one plan, one invoice, one place to look when something needs checking.
Each team member gets their own API keys and their own usage view. That is worth a moment. Because usage is broken out per key, you can see which part of your stack is driving your request units, so capacity is something you plan rather than guess at. It also means nobody has to share a credential: rotating one key leaves everyone else working. Permissions and billing stay with you as the account owner.
Edit defaults on the same page sets the policy every new member starts with: which plan pays for their requests, whether they can create their own keys, a usage limit per billing period, which chains they can reach. Set it once and every invite is pre-filled.
Will the dashboard warn me before I run out?
Yes. Account alerts email you at 80%, 90% and 100% of your included request units, so a busy week never turns into a surprise. You can add one custom threshold of your own under Settings, then Notifications.
Start building
The dashboard removes the last bit of friction between you and a production-grade RPC endpoint. Sign up, grab a key, send your first request: the whole loop takes minutes.
Start your free trial at dashboard.boltrpc.io
Stuck somewhere? Email [email protected] or use the contact form.
No credit card. Every network on the Networks page.
FAQ
How do I sign in? Is there a password?
Both. You choose a password when you sign up, and after that you can sign in with that password, with a magic link sent to your inbox, or with your Google or GitHub account, all at dashboard.boltrpc.io.
How do I get my API key?
Sign in and open API Keys in the sidebar. During the free trial your key is created for you: reveal it and copy it. On a paid plan you create keys yourself. Reveal and Copy stay available at any time.
Where do I find my endpoint URL?
Every network follows the same pattern: https://endpoints.boltrpc.io/rpc/YOUR_API_KEY/{network} for HTTPS. WebSocket endpoints swap /rpc/ for /ws/ on the wss:// scheme.
What happens when my free trial ends?
Nothing scary. We never took a credit card, so there is nothing to auto-charge. Pick the plan that fits your volume on the Billing page. If you are unsure which tier you need, your Usage page shows exactly how many request units your trial consumed: that number is your answer.
How are request units counted?
Every method has a fixed, published RU weight: 3 for most standard calls, 4 for eth_getLogs, 5 for eth_sendRawTransaction. Your plan gives you a monthly RU budget. The complete table is in the request unit guide.
Which chains can I use?
BoltRPC serves the EVM chains you expect (Ethereum, Polygon, Base, Arbitrum, Optimism, BNB Chain, Avalanche, zkSync, Linea, Scroll) alongside non-EVM networks (Solana, Sui, Aptos, Bitcoin, Tron, Starknet), all from one key. The Networks page has every slug, with live latency per chain.